


Volume 43
Published on November 2023Volume title: Proceedings of the 7th International Conference on Economic Management and Green Development
The purpose of this study is to compare the differences in disclosure quality between Chinese and American companies listed in the United States. Despite the fact that Chinese companies listed on a U.S. stock exchange are required to adhere to the same disclosure and financial reporting regulations as U.S. companies listed on that exchange, variations between the two persist. Consequently, this study seeks to explore and compare the specific disparities in disclosure quality between Chinese companies listed in the U.S. and American companies. The "use of proceeds" section of the initial IPO prospectus for both American and Chinese companies will be employed to assess the specificity of disclosure quality. Statistical data sampling and analysis will be conducted to compare their specificity of disclosure. Finally, a T-test will be employed to compare and contrast the results. Based on our research findings, it can be concluded that Chinese companies listed in the U.S. exhibit a significantly higher overall quality of information disclosure compared to domestically listed U.S. companies.


In order to obtain a higher long-term average return from a portfolio, investors need to increase the level of risks that cannot be dispersed by diversification in the portfolio, and the asset pricing model can help investors to judge how much risk is reasonable to take. This paper will introduce the development process of several asset pricing models, and integrate and overview the applicability of the above several asset pricing models in China’s capital market by combining the relevant research of domestic and foreign scholars over the years based on existing literature and data analysis results. Finally, it can be found that due to its strict prerequisites, Capital Asset Pricing Model (CAPM) has the lowest applicability in the Chinese stock market, while the Five-Factor Model and the pricing model based on beta decomposition both have good applicability, but it is hard to say which one is the best one to adapt to the Chinese stock market at present.
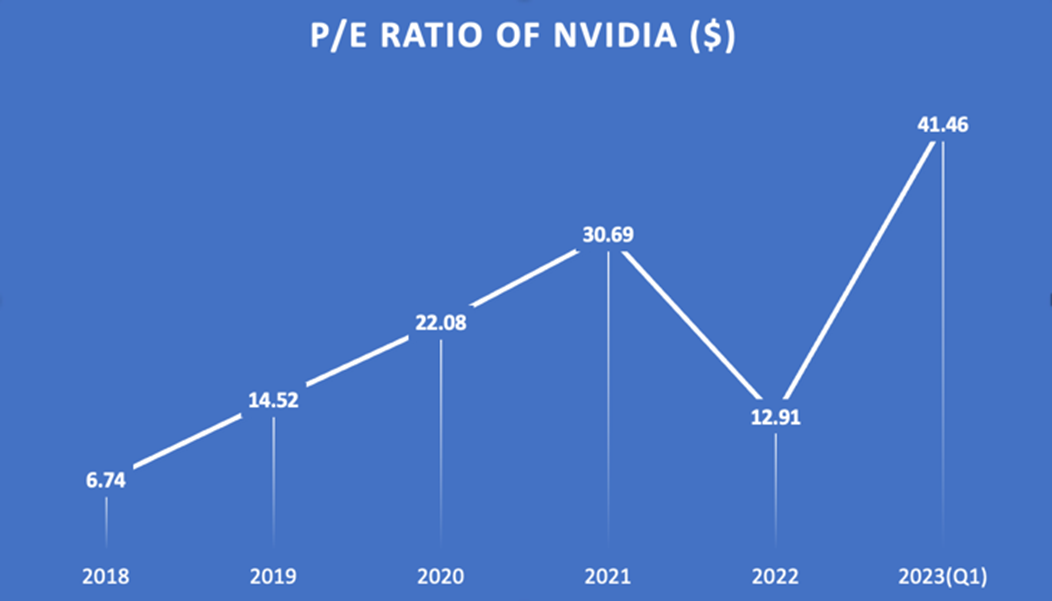
As AI technology is at the heart of technology and driving the world's economy in different forms, NVIDIA was once again in the industry spotlight and where the world's attention was gathered at the end of May this year. This paper provides a financial analysis of this company's key figures and a comparison and commentary with its peers, using NVIDIA's fiscal year 2023 as the primary data base. It contributes recommendations for NVIDIA, the leading company, and provides ideas for the development of the related technology industry. Through the comparison of cross-sectional data, NVIDIA presents its internal data in an objective and clear manner, with significant changes in data that are reasonably and comprehensively articulated and well documented. In comparing the company's financials, NVIDIA performs well and has strong and core competitive capabilities. Using the formulas to estimate the stock price and enterprise value, NVIDIA is greatly overvalued. The reasons for this and the potential risks of the company are presented at the end of this paper.
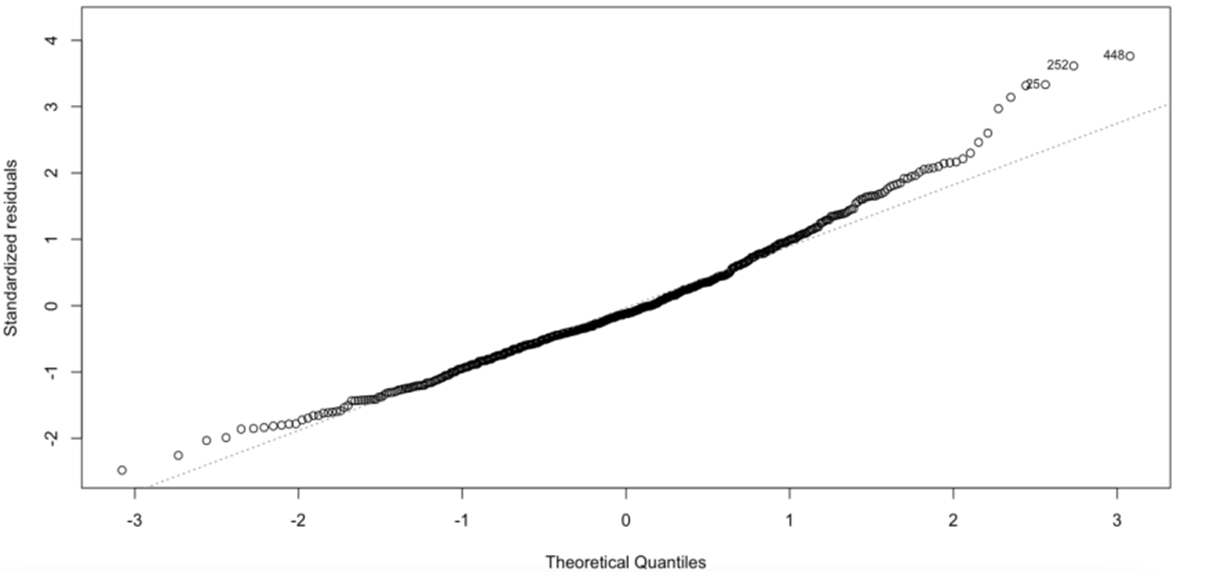
The study focuses on the phenomenon of initial public offering (IPO) underpricing in China's Science and Technology Innovation Board (STAR market). The study employs the stochastic frontier model to analyze IPO underpricing and decomposes it into two components: primary market underpricing and secondary market premium. Additionally, the research investigates the impact of research and development (R&D) investment on IPO underpricing. The empirical analysis is based on a sample of 480 companies listed on the STAR market between July 2019 and January 2023. The results reveal that IPO underpricing on the STAR market is substantial, with an average underpricing rate of 131.81%. The primary market underpricing component contributes 4.24% to the overall underpricing rate, while the secondary market premium accounts for the remaining 95.76%. Furthermore, the study explores various factors that influence the secondary market premium using multiple linear regression analysis. The findings indicate that variables such as issuance volume, underwriting fee, turnover rate, and R&D investment significantly impact the secondary market premium.
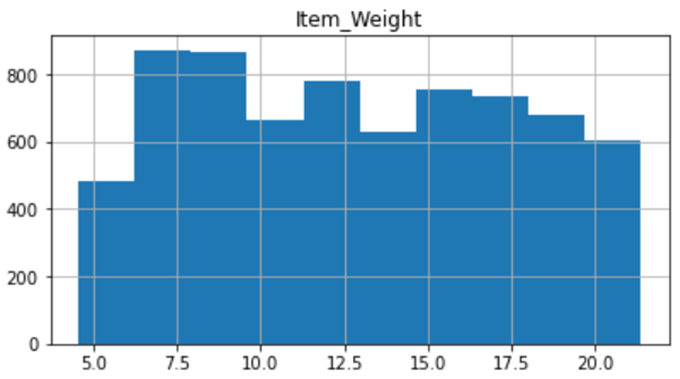
In order to have a brief insight into the process of business data analysis for the big mart’s product and through which to find out the inner logic about data analysis. This research did a brief research based on the big mart sales dataset from Kaggle. The data are collected in 2013 for 1559 products across 10 stores in different cities. This research aims to build a predictive model and forecast the sales of each product at the specific stores and then try to understand the properties of products and outlets which play a key role in increasing sales. After using some basic analysis methods based on python, the author gets the distribution outcome of a big mart’s product and creates five simple models to predict the final outlet-sales and find out the most performed model using MAE criteria. The outcome shows that finally the XGB Regressor model performed best and for the real business, it is the most suitable selection.
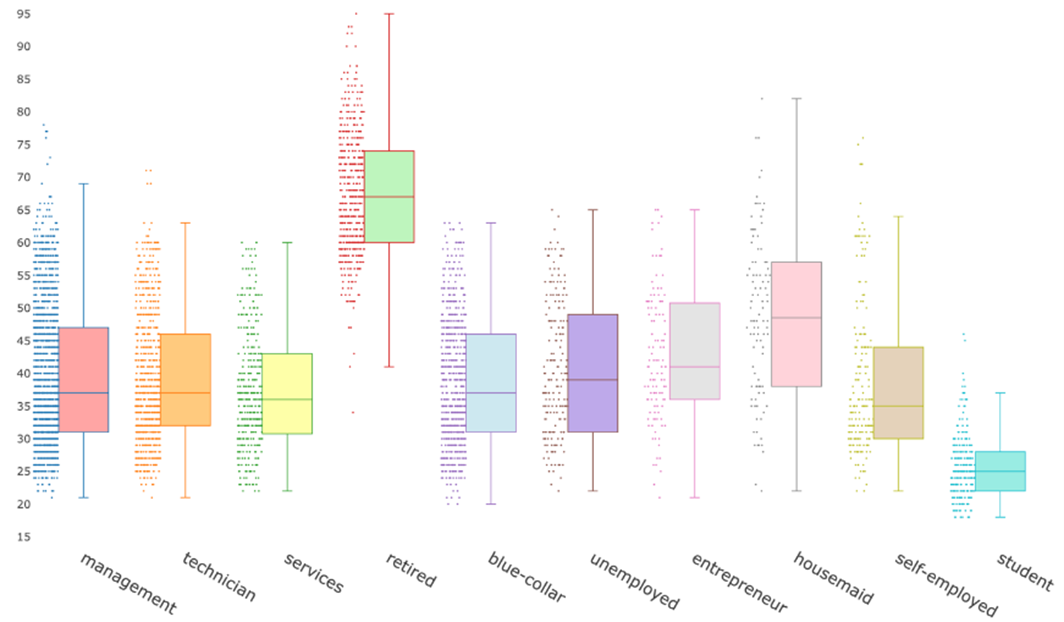
Bank telemarketing campaigns play a pivotal in fostering customer relationships and promoting financial products. However, the factors that contribute to the success of these campaigns are multifaceted and often elusive. This study utilizes a range of machine learning techniques to analyze an extensive dataset of telemarketing campaigns from a Portuguese banking institution, shedding lights on critical determinants of its success. The data underwent the application of several machine learning algorithms, including Decision Trees, Random Forest, Logistic Regression, Gradient Boosting, and Naïve Bayes, facilitating the discovery of notable patterns and correlations. Findings revealed that variables such as age, occupation, seasonality, and the number of phone calls exert significant influence on campaign outcomes. By leveraging these insights, banking institutions and marketing strategists can craft more effective, data-driven telemarketing strategies. This in turn stands to enhance marketing efficacy, customer acquisition, and retention, translating into improved business performance.
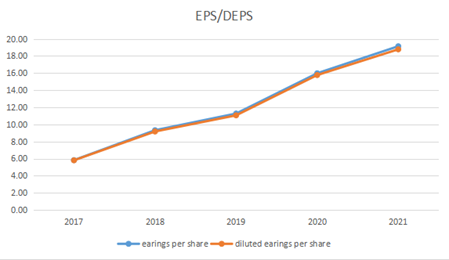
This article aims to analyze the overall performance of Nike Inc. over the past three years and make predictions about its future. Firstly, the paper will discuss the three most significant accounting policies in Nike's 2022 annual report. This will help determine the company's asset management and utilization, profitability, and long-term development trends. Furthermore, the article will evaluate the company's performance in the previous year by comparing various financial ratios with its competitors in the Nike industry. This assessment will enable an evaluation of the company's financial position, and operational achievements, and showcase Nike's position within the industry. Lastly, based on Nike's overall performance in 2022, the paper will provide forecasts for the next two years regarding Nike's market value and performance. As a leading brand in the world of sports goods, Nike has proven through practice to be one of the most successful companies to date. It has adopted a strategically significant product portfolio strategy, resulting in significant market advancements. The conclusion of this article will contribute to other sports goods brands learning from Nike's relevant marketing strategies, thereby driving the overall development of the industry.
Scale effect in the stock market refers to the negative correlation between company size and expected return, which is a common anomaly in the financial market. Investor sentiment is the opinion that investors create based on their expectations of the potential future cash flow from their assets and the inherent dangers of making investments. The initial goals of this paper were to develop an investor sentiment index system and investigate how it relates to the market scale impact. In this paper, principal component analysis and the CICSI index, which can better measure Chinese investor sentiment, are combined to construct investors More than 3000 sample stocks are grouped by size, the average return rate of each group is calculated, and the scale effect is tested. Through the verification of the scale effect under the optimistic, neutral, and pessimistic sentiment index, the applicability of generated sentiment index to the scale effect is confirmed.
With the rapid development of economics, customers tend to favour clothes that are fashionable, light and comfortable, so the competition in the clothing industry is fierce. In order to gain steady growth and an advantageous position, companies have to transform to adapt to the changing environment. This paper concentrates on Bosideng, which is in the leading position in the clothing industry and has transformed successfully, so it can be a great example. This article uses case study: firstly, the article introduces the background of its transformation, using Porter’s five forces model and SWOT analysis to explain why Bosideng needs to transfer. Then, citing the 4P model to analyze how Bosideng could transform successfully. At last, through financial analysis, Bosideng has achieved better financial performance after the transformation, which means that the transformation is effective. From the case study, it is clear that when diversification could not sustain the company’s development, going back to the main business might be a wise choice. This article’s analysis might provide some experience for other companies.
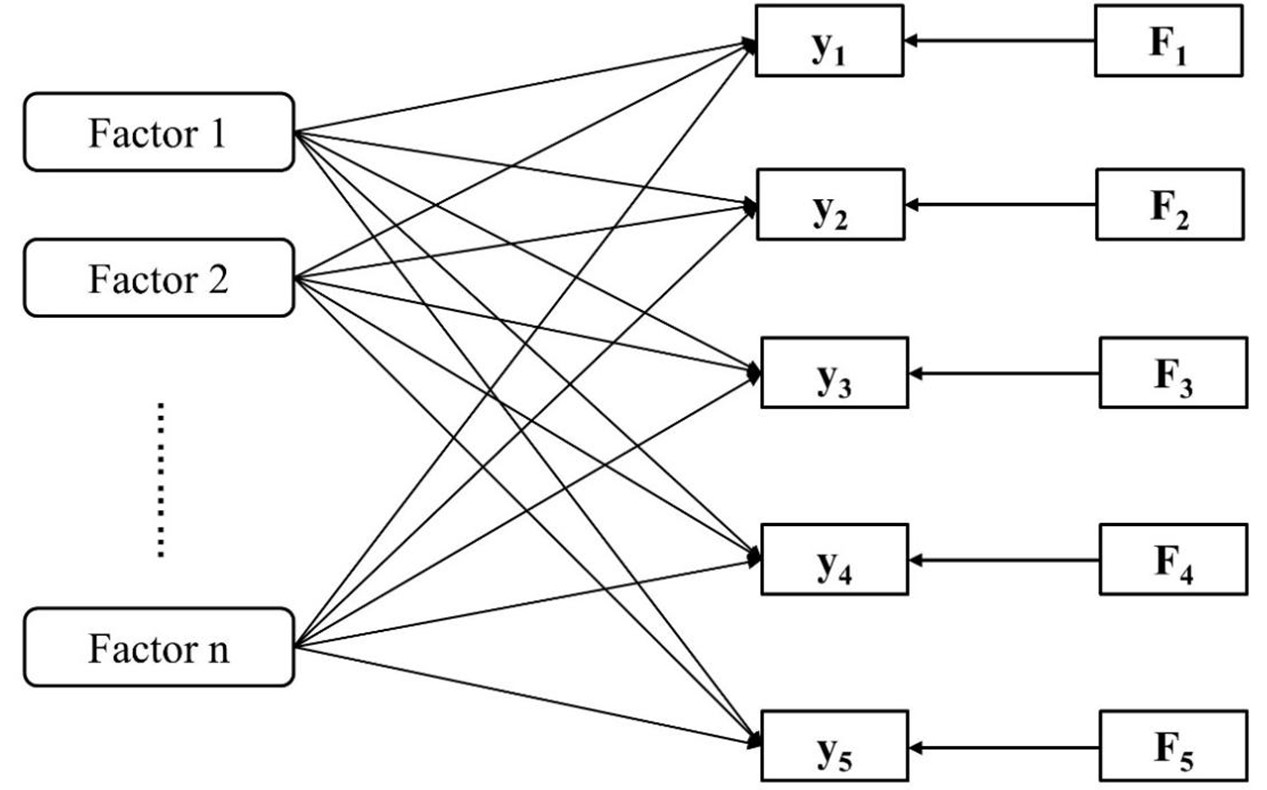
The development of China's securities market has been more than 30 years, among which China's A-share market has become one of the largest stock markets in the world, and has a good development trend. Since the new era, the digital economy has become an indispensable part of people's lives. Cloud computing related conceptual stocks have received increasing attention from the capital market since 2019. Therefore, this paper classifies the cloud computing stocks and gives some suggestions to investors. 47 cloud computing stocks were randomly selected and their basic data were downloaded from the RESSET database. Through sorting and constructing, two categories of market indicators and fundamental indicators are selected, with a total of 17 variables. In order to reduce the dimensionality of variables, five common factors were first extracted using Factor Analysis and named as price factor, transaction factor, debt paying factor, growth factor, and profit factor according to their characteristics. Using these five factors to carry out K-means clustering, the selected stocks are divided into mature stocks and ordinary stocks.